The Benefits of Using Website Heatmaps
When it comes to working on websites, you may have heard the term Heatmaps. But what exactly are Heatmaps, and what value do they provide to webmasters? In today’s post, we’re going to dive into just that. We will examine what heatmaps are, the different variants, how to use them, and if they have any drawbacks. So, let’s dive straight into it and have a close look at Heatmaps.
What are Heatmaps?
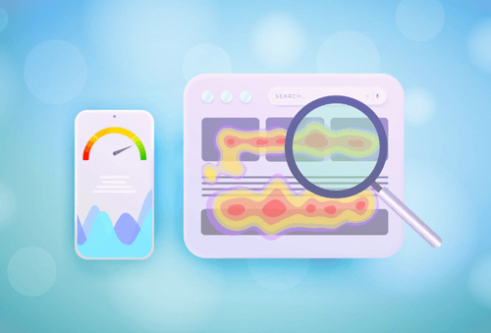
So, let’s begin by explaining exactly what a heatmap is. Heatmaps are visual/graphic web analytic tools that represent a variety of data. When we talk about Heatmaps and websites, it is a way of displaying information about how users are interacting with your site. The data is displayed using colours; the brighter the colour, the more interaction takes place.
Webmasters can use this information to determine the placement of important buttons and content to ensure users are seeing it. By correctly using the information from a heat map, Webmasters can potentially help boost user engagement and retention.
The Origins of Heatmaps
The usage of Heatmaps is thought to have originated in the 19th Century. It was a practice of manually shading cells in a table to depict the data set. This was typically done in grey scale. The practice has evolved substantially since then, and now we have multiple ways to depict different data sets.
What Heatmaps Display
As we mentioned, heatmaps allow you to quickly and easily see how visitors interact with your site and content. Heatmaps are colour-coded, so you can quite literally see what is hot and what is not. What works, and what does not.
They can provide actionable insights into your visitor’s behaviour, see how people scroll, what they click on, and what they try to click on.
Why use Heatmaps – The Benefits
Heatmaps use visuals and bright colours to represent the information. As such, it is far quicker and easier to analyse this information. The visual representation of this information can help:
- See if users are scrolling far enough to see important content
- See if users are finding your most important links, buttons, and Call to Actions
- See if users are trying to click on elements that are not clickable
Heatmaps make it quick and easy to understand this information, making it very valuable for A/B Testing or if you are considering redesigning the look of your website.
Popular Types of Heatmaps
Heatmaps are not just a one-size-fits-all situation. In fact, there are multiple different types of heatmaps, each displaying a different set of data. In total, there are five popular types of heatmaps, but some tools might have even more types. Let’s dive into the most popular versions of Heatmaps and see what info they provide.
Scroll Map
The first type of Heatmap that is popular with webmasters is the Scroll heatmap. As the name suggests, this Heatmap shows you how far your page users are scrolling. With this information, you can ensure the most important content is located high enough for most users to see it.
Click Map
A click map will show you where users are clicking. It is able to track this information whether the visitor is using a desktop computer, with a mouse, or their mobile device. The colour coding will easily tell you where users are clicking. You can now tell if people are actually clicking on your links or if they are missing them.
Move Map
The Move Map will track users’ mouse movement as they navigate your site. The brighter the colour, the more often the mouse is moved in that area. In some ways, this can be seen as a budget version of eye-tracking. Many users will move their mouse over content as they read through it, so it gives you an indication of where they are looking.
Engagement Map
The Engagement Map combines the information from several other heatmaps. Typically, the Engagement Map will combine information from the Scroll Map, Click Map, and Move Map. It provides a well-rounded view of several data points.
Rage Map
Finally, we get to the Rage Map. This Heatmap will show you where users might be trying to click on a non-clickable element. This is likely an indication of where users are getting frustrated with your site. If you notice there are areas where users are trying to click, it is an indication to add a link or button to that area potentially.
Heatmaps for Desktop, Mobile, and Tablets
Heatmaps can also display information depending on the platform the user is using. This means you can specifically check desktop, mobile, or tablet. It is important to consider all of this information, as your site will display differently on the platforms. Information that might be in a prominent location on desktop might be further down on mobile, and as such, miss out on engagement.
How to Create a Heatmap
After learning about the information a heatmap can provide you with, you might now be eager to give it a try. So, how do you go about creating one? Unfortunately, in order to create a heatmap, you will need to select a dedicated heatmap tool. Most of these are paid services, but they do offer free trials, so you can test them out before buying. Some of the most popular website heatmap tools include:
- Hotjar
- Smartlook
- Crazy Egg
- Lucky Orange
Once you have chosen which tool you want to use, go ahead and create your account. The tool will provide you with some code, which you need to insert into your site. You will likely find a dedicated tutorial showing you where the code must be inserted on the most popular Content Management Services, like WordPress, Wix, or Squarespace. This is a similar process to how you link your website to Google Search Console or Google Analytics.
Once you have instered the code, your tool will be able to start tracking the information.
The Limitations of Heatmaps
So far, we’ve covered the benefits of Heatmaps and the information they can provide. However, as with most things in life, there are some limitations as well. Below are some of the limitations you might find when using them.
- Some Webmasters find the information they provide to be quite obvious and non-actionable. How does it help to know there is a hotspot around your links or images? Did the webmaster really need a tool to tell them that?
- Most heatmaps show you the aggregated information from all users over a set period of time. This means that they cannot show how individual users interact with your site and the journey that particular user takes through your site. However, some tools can provide this kind of information.
- Heatmaps are also not a viable tool to use on all websites. Some tools cannot properly track dynamic content. So, if your chosen tool does not record individual user sessions, it could run into problems with sites that use a lot of JavaScript. Heatmaps can also struggle with sites that frequently change their content, such as social media sites. The information provided by the Heatmap can be very unreliable for these kinds of sites.
Wrapping Up Heatmaps
Despite the limitations of Heatmaps, we feel that many webmasters will still gain valuable insight into how users interact with their content. By using this information to guide your changes it can help put important information in the right place and boost your user retention and engagement.